COVIS Diffuse Flow Time Series
This is a description of the COVIS processed DIFFUSE mode data. Documentation for the raw data is also available.
This data product can take time to process. Data products are pre-processed for quick retrieval. However, the pre-processing may not be up to date, in that case, data products will be generated on-the-fly, which can take 1-2 minutes per 3 hour file.
Oceans 3.0 API filter: dataProductCode=CDFD
Revision History
- 20120801: Initial product released
- 20131114: Updates, bug fixes
Formats
MAT, PNG and PDF data products are generated for the DIFFUSE mode. Content descriptions and example MAT and PNG files are provided below. Detailed information and further concern please refer to Principle Investigator’s Website
MAT
MAT file contains two structures: metadata and covis. The metadata structure contains the following information:
- deviceID: A unique identifier to represent the instrument within the NEPTUNE Canada network.
- creationDate:Date and time (using ISO8601 format) that the data product was produced. This is a valuable indicator for comparing to other revisions of the same data product.
- deviceName: A name given to the instrument.
- deviceCode: A unique string for the instrument which is used to generate data product filenames.
- deviceCategory: Device category to list under data search ('Echosounder').
- lat: Obtained at time of deployment.
- lon: Obtained at time of deployment.
- depth: Obtained at time of deployment.
- deviceHeading: Obtained at time of deployment.
- siteName: Name corresponding to its latitude, longitude, depth position.
- locationName: The node of the NEPTUNE Canada observatory. Each location contains many sites.
- deploymentDateFrom: The date of the deployment on which the data was acquired
- deploymentDateTo: The date of the end of the deployment on which the data was acquired
- samplingPeriod: Sampling rate of the instrument in seconds.
- searchID: The search ID from the data search details structure used to find this data (not applicable to post-processed MAT files)
The covis structure contains all the parameter information and the gridded data in the following structures: type, comments, user, sonar, processing, grid, sweep, beamformer, ping and calibrate.
type: type of mode (i.e., diffuse for DIFFUSE mode)
comments: information from the COVIS team used to describe the experiment.
user: structure containing input parameters for MATLAB code to generate MAT and PNG files from raw tar file.
- verbose: tells whether information on the processing progress is written to the screen or not. Default value is 1 for both imaging and diffuse modes.
- debug: controls whether individual pings are plotted or not. Default value is 0 for both imaging and diffuse modes.
- view: sets the direction from which the data will be viewed in the usual MATLAB orientation units.
- azimuth: azimuth of the Matlab 3D view. Default value is 37.5
- elevation: elevation of the Matlab 3D view. Default value is 30
- output: path of output files. Default value is ''.
sonar: structure containing information about sonar itself.
- position: structure containing the sonar position
- easting: default value is 492669.
- northing: default value is 5310678.
- depth: default value is -2205.0.
- altitude: default value is 4.2000.
- declination: default value is 18.
processing: structure containing parameters controlling the processing
- beamformer: type of beamforming.
- type: default value is “fast”.
- calibrate: type of calibration mode.
- mode: “VSS” for imaging mode file and “TS” for diffuse mode file.
- filter: controls the filtering part of the processing.
- status: default value is “on”.
- type: default value is “buttorworth”.
- bw: default value is 2, which means the bandwidth in Hz will be 2/pulse length.
- order: filter order. Default value is 4.
- ping_combination: explains how pings are combined: average or difference.
- mode: default value is “diff”, which means a difference of successive pings is used in order to reduce unwanted ground return.
- bounds: explains value range for processing (Note that it does not affect data collection). This structure does not exist for diffuse mode file.
- pitch: range of rotator elevations (degrees) over which data is processed.
- start: default value is 10.
- stop: default value is 62.
- heading: heading of the sonar (degrees). There is a physical possibility that this could actually vary during data collection.
- start: default value is 235.
- stop: default value is 235.
- range: distance (meters) out a ping over which to process
- start: default value is 5.
- stop: default value is 75.
- pitch: range of rotator elevations (degrees) over which data is processed.
- correlation: These parameters are used in the cross-correlation of two complex series
- window_size
- window_overlap
- windthresh
- nlag:
grid: structure contains what kind and size of grid used in the final stage of processing.
- type: what the values in the grid mean. Default value is “back-scatter cross section” for imaging mode file, and is “decorrelation intensity” for diffuse mode file.
- shape: shape of the grid. Default value is “rectangular”.
- units: units for the output grids
- spatial: default value is “meters”.
- Value: default value is “1/meters”.
- dimensions: number of dimensions in the grid. Default value is 3 for imaging mode, and is 2 for diffuse mode.
- bounds: bounds of the grid.
- xmin: default value is -35.
- xmax: default value is 5.
- ymin: default value is -25.
- ymax: default value is 5.
- zmin: default value is 5. This parameter does not exist if grid.dimentions is 2.
- zmax: default value is 50. This parameter does not exist if grid.dimentions is 2.
- spacing: size of the grid elements.
- dx: default value is 0.25 for imaging mode file, and is 0.5 for diffuse mode file.
- dy: default value is 0.25 for imaging mode file, and is 0.5 for diffuse mode file.
- dz: default value is 0.25. This parameter does not exist if grid.dimentions is 2.
- x: matrix with 121*161*181 elements.
- y: matrix with 121*161*181 elements.
- z: matrix with 121*161*181 elements. This parameter does not exist if grid.dimentions is 2.
- v: matrix with 121*161*181 elements.
- w: matrix with 121*161*181 elements.
- size: default value is 121, 161, 181 for imaging mode file, and is 61, 81 for diffuse mode file.
- axis: default value is -35,5,-25,5,5,50 for imaging mode file, and is -35, 5, -25, 6, 0,0 for diffuse mode file.
- name: filename for MAT and PNG files.
sweep:
- sequence_id
- alpha_id
- mode: diffuse
- timestamp
- alpha_rev
- endtime
- annotation
- schema
- path: location for processed raw tar file
- name: processed raw tar filename
beamformer:
- type: default value is “fast”.
- fc: default value is 200000.
- c: default value is 1495.
- fs: default value is34483.
- first_samp: default value is 1.
- last_samp: default value is 2307.
- array_length: default value is 0.4080.
- start_angle: default value is -64.
- end_angle: default value is 64.
- num_beams: default value is 128.
- angle: an array contains 128 float numbers from -1.1170 to 1.1170.
- range: an array contains 2307 float numbers from 0.0217 to 50.01.
ping: structure array contains covis ping meta. A structure is created when the parameters change. One structure contains the following parameters:
- num
- sec
- rot:
- pitch
- roll
- yaw
- tcm:
- kPAngle
- kRAngle
- kHeading
- hdr:
- control:
- auto_range_method
- bd_range
- auto_bd_filter_method
- bd_depth
- auto_gain_method
- power_sel
- ping_num
- prj:
- horiz_width
- window_type
- horiz_angle
- vert_width
- window_param
- focal_point
- id
- vert_angle
- max_ping_rate
- envelope_type
- multi_ping
- xmlt_freq
- sound_speed
- absorption
- range_sel
- pulse_type
- hydrophone_id
- transmit:
- yaw_stablization
- pitch_stablization
- bd:
- max_range
- min_range
- min_depth
- max_depth
- pulse_extra
- ping_period
- rcvr_bandwidth
- recv:
- window_type
- flags
- window_param
- beam_width
- sonar_id
- gain_sel
- sample_rate
- spreading_loss
- pulse_width
- envelope_param
- control:
calibrate:
- mode: “VSS” for imaging mode file and “TS” for diffuse mode file.
- filt
- filt_bw
Oceans 3.0 API filter: extension=mat
PNG
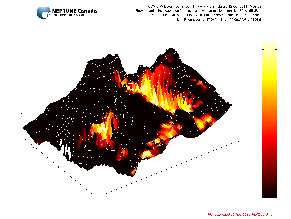
The image for the DIFFUSE mode data shows the average decorrelation intensity, in a dB scale, draped over the bathymetry. All distances are in meters relative to the sonar position. Tick labeling on the axes was left off due to technical difficulties in rendering the fonts (we could either render the 3D transparency or the fonts but not both, this is a short coming of running Matlab in Linux, which may improve in the future).
Oceans 3.0 API filter: extension=png
Example:
The PDF plot shown is the same as the PNG, however, PDF files can contain multiple plots in a vectorized form, which is better for high resolution printing or zooming.
Oceans 3.0 API filter: extension=pdf
Discussion
To comment on this product, click Add Comment below.