Spatial Scalar Plot
Spatial scalar plots show mobile data plotted on a map, colouring the plotted points with the value of the data. These plots are used for time-series scalar data from a single sensor on a mobile device, particularly one that moves on a repeating route, such as a ferry or a glider, for which the data is constrained to an known area. The positioning data may come from another device, such as a GPS, collocated with the requested sensor and device. As is done for all mobile scalar data, mobile position ancillary data is interpolated onto the requested sensor's time series, as further described here: Positioning and Attitude for Mobile Devices. Plots are normally broken into daily segments. Since these plots are only active for ferry data, daily plots are tuned to the ferry schedule. Daily plots show data from 12:00 UTC to 9:00 UTC the following day (this works out to 4/5 AM to 1/2 AM PST/PDT local time). As described in the data product options, users can also select a contiguous plot, which is intended to be used with 1-minute averaging to produce a plot of 1 month of data. If there are any QAQC flags to display, the plot will show them with the usual highlighting flag and an 'x' marker on the affected data point.
Oceans 3.0 API filter: dataProductCode=SSP
Revision History
- April 1, 2015: initial release
Data Product Options
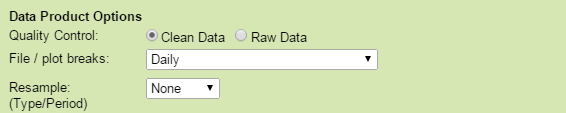
Quality Control: Clean Data
For time series scalar data, selecting this option will cause any data values with quality control failures (QAQC flags 3 and 4) to be replaced with NaNs. Because NaNs cannot be plotted, quality control failures will be excluded from any plots under the clean option. This is the default option.
Oceans 3.0 API filter: dpo_qualityControl=0
Quality Control: Raw Data
When this option is selected, raw data will be supplied in the data products: no action is taken to modify the data. In general, all scalar data is associated with a quality control flag. For plots, data that fail quality control are marked on the plot with coloured data points and/or flag markers for emphasis.
Oceans 3.0 API filter: dpo_qualityControl=1
File / plot breaks: Daily
When this option is selected, the file or plot will break every daily at a prescribed times (not necessarily on midnight). The search will return with one plot per day of data. This is the default option.
Oceans 3.0 API filter: dpo_fileplotbreaks=1
File / plot breaks: None (files break on size limits only)
When this option is selected, the file or plot will not break unless it becomes too large. (Only available for Clean Data option).
Oceans 3.0 API filter: dpo_fileplotbreaks=0
Resample (Type/Period)
When the file breaking option is set to None and data quality is set to clean, this option is available so that users may generate long time series plots. 1-minute averaging will generate a good plot for one month of data (need at least 5 days of data to begin to fill the plot, at least 1 month for 5-minute averaging). The plots will break into multiple files if there's more than 36 days of data for 1-minute averaging, 180 days for 5-minute averaging (limited by matlab's ability to plot and render coloured markers).
Oceans 3.0 API filter: dpo_resample=none
File-name mode field
'clean' is added to the file-name when the quality option is set to clean data.
Formats
Spatial scalar plots are available in PNG or PDF format. The first example below is a normal spatial daily plot data from the Tsawwassen - Duke Point ferry route. If a search covers multiple days, the daily plots will use the same plotting ranges, making comparisons much easier; the PDF product appends multiple plots together in a single, making scroll through the plots even easier. The second example below is a 1-minute average spatial plot for a month of data for the Swartz Bay - Tsawwassen ferry route. If there is no positioning data, but the requested sensor does have normal scalar data for the time range, the user will see an empty plot as shown in the third plot below: 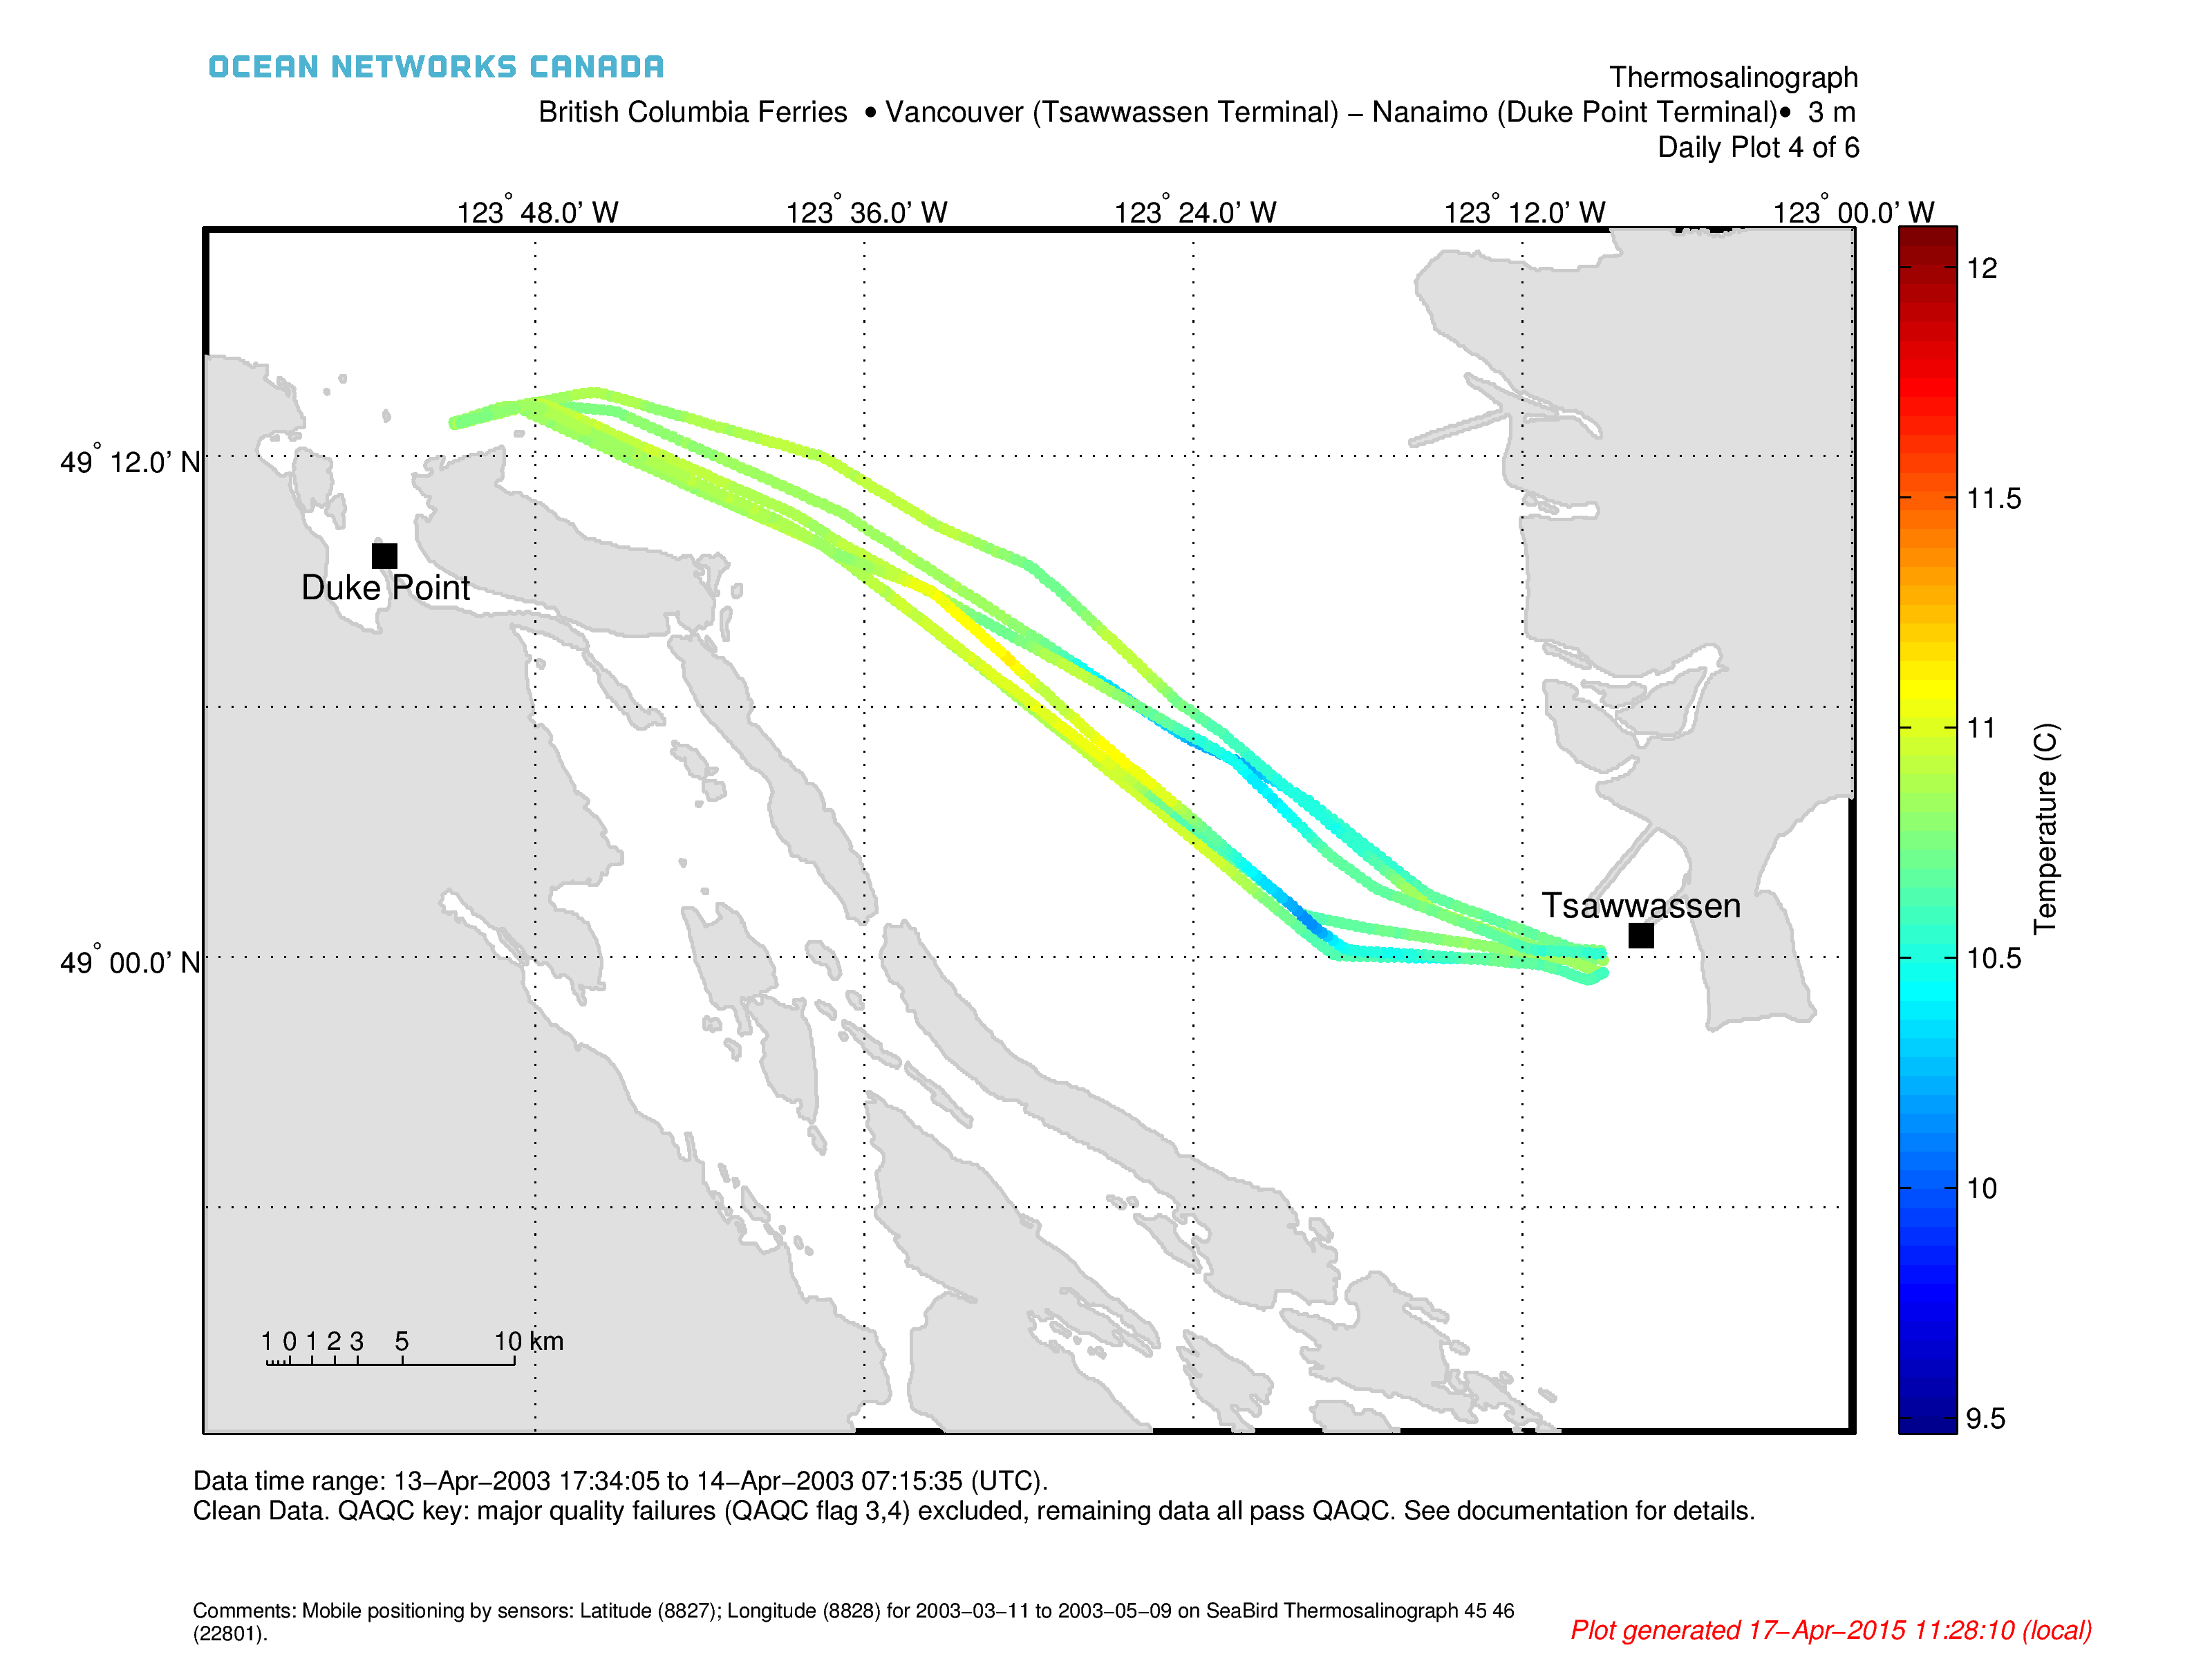


Oceans 3.0 API filter: extension={png,pdf}
Discussion
To comment on this product, log in and click Write a comment below.