Seismometer Data
All seismometer data is routed directly to IRIS, after passing through a military-controlled driver machine (see the Diversion of Tier 1 data for more information on diversion). The seismometer data products offered via Data Search and Data Preview are produced by calling IRIS webservices to get the data. Users can refer to direct links to the IRIS seismometer pages that appear at the top of Data Search Step 2 to access more data. The data products offered here are used to provide plots for Data Preview and rudimentary, accessible data for users.
Oceans 3.0 API filter: dataProductCode=SD
Revision History:
- 20160704: Initial release
Data Product Options
Example (https://data.oceannetworks.ca/DataSearch?location=CQS64&deviceCategory=BBS)

For more information, see the IRIS URL builder page and click on the usage button: https://service.iris.edu/irisws/timeseries/docs/1/builder/ Here are the options:
High-Pass 1 Hz: A 1 Hz high-pass filter is applied to all requested data excluding low-rate data of 1 sample per second (LHZ, LHN, LHE). Due to the nyquist frequency of 1 sample per second data being 0.5 Hz, only a high-pass filter of 0.5 Hz is applied to the low-rate data.
Oceans 3.0 API filter: dpo_filteringOptions=HP_1
High-Pass 0.5 Hz: A 0.5 Hz high-pass filter is applied to all requested data.
Oceans 3.0 API filter: dpo_filteringOptions=HP_0.5
Low-Pass 1 Hz: A 1 Hz low-pass filter is applied to all requested data excluding low-rate data of 1 sample per second (LHZ, LHN, LHE). Due to the nyquist frequency of 1 sample per second data being 0.5 Hz, no filter is applied to the low-rate data.
Oceans 3.0 API filter: dpo_filteringOptions=LP_1
Band-Pass 0.01-1 Hz: A 0.01 – 1 Hz band-pass filter is applied to all requested data excluding low-rate data of 1 sample per second (LHZ, LHN, LHE). Due to the nyquist frequency of 1 sample per second data being 0.5 Hz, no filter is applied to the low-rate data.
Oceans 3.0 API filter: dpo_filteringOptions=BP_0.01_1
No Filter: No filter is applied to the data.
Oceans 3.0 API filter: dpo_filteringOptions=
File-name mode field
'LP', 'HP' or 'BP' is added to the file name (at the end, after the date, separated by a '-'). The option value is added as well, for example '-BP_0.5_1', or '-HP_0.5'.

The Seismometer Channel Option allows you to specify which channel(s) you would like to receive data for. An explanation of seismometer channel codes can be found on the IRIS website here: https://ds.iris.edu/ds/nodes/dmc/tools/data_channels/#. In the channel code the last value represents sensor orientation, where N/E are the North/East cardinal directions and Z is vertical. 1/2/3 are non-cardinal orientations, which generally occur in seismometer data when an instrument is deployed that is not correctly aligned with geographic North or is horizontally tilted.
Here are the options:
Vertical Velocity (High-Rate/Low-Rate Overlaid In Plots): High-rate and low-rate vertical velocity data will be overlaid and plotted on one graph. For broadband seismometers, this will be H- or C-band for the high-rate channel and M- or L-band for the low-rate channel depending on the requested time range. For short period seismometers, this will be high-rate E-band and low-rate M- or L-band.
Oceans 3.0 API filter: dpo_seismometerChannel=*Z
High-Rate Vertical Velocity: High-rate vertical velocity data will be plotted on one graph. For broadband seismometers, this will be H- or C-band. For short period seismometers, this will be E-band.
Oceans 3.0 API filter: dpo_seismometerChannel=HHZ
Low-Rate Vertical Velocity: Low-Rate vertical velocity data will be plotted on one graph. For broadband and short period seismometers, this will be M- or L-band depending on the requested time range.
Oceans 3.0 API filter: dpo_seismometerChannel=MHZ
High-Rate Velocity - All Components: All high-rate velocity data will be plotted on separate graphs. For broadband seismometers this will be H- or C-band. For short period seismometers this will be E-band.
Oceans 3.0 API filter: dpo_seismometerChannel=HH*
Low-Rate Velocity - All Components: All low-rate velocity data will be plotted on separate graphs. For broadband and short period seismometers this will be M- or L-band.
Oceans 3.0 API filter: dpo_seismometerChannel=MH*
Horizontal Acceleration (High Rate/Low Rate Overlaid in Plots): High-rate and low-rate horizontal acceleration data will be plotted and overlaid on one graph, where high-rate will be C- or H-band and low-rate will be M-band.
Oceans 3.0 API filter: dpo_seismometerChannel=*N12
High-Rate Horizontal Acceleration: High-rate horizontal acceleration data will be plotted on one graph for C- or H-band.
Oceans 3.0 API filter: dpo_seismometerChannel=CN12
Low-Rate Horizontal Acceleration: Low-rate horizontal acceleration data will be plotted on one graph for M-band.
Oceans 3.0 API filter: dpo_seismometerChannel=MN12
High-Rate Acceleration - All Components: All high-rate acceleration data will be plotted on separate graphs for C- or H-band.
Oceans 3.0 API filter: dpo_seismometerChannel=CN*
Low-Rate Acceleration - All Components: All low-rate acceleration data will be plotted on separate graphs for M-band.
Oceans 3.0 API filter: dpo_seismometerChannel=MN*
Velocity - All Components (High Rate/Low Rate Overlaid in Plots): High-rate and low-rate velocity data will be plotted and overlaid on one graph for each orientation. For broadband seismometers, this will be H-band for high-rate and M- or L-band for low-rate depending on the requested time range. For short period seismometers, this will be E-band for high-rate and M- or L-band for low-rate.
Oceans 3.0 API filter: dpo_seismometerChannel=*H*
Acceleration - All Components (High Rate/Low Rate Overlaid in Plots): High-rate and low-rate acceleration data will be plotted and overlaid on one graph for each orientation. For broadband accelerometers, this will be C- and/or H-band. For long period accelerometers, this will be M-band.
Oceans 3.0 API filter: dpo_seismometerChannel=*N*
All Channels (High-Rate/Low-Rate Channels Overlaid In Plots): The All Channels Option will plot all available channels for the seismometer including velocity and accelerometer data, as well as pressure data. The high-rate and low-rate velocities and accelerations will be overlaid with matching orientations. If the selected output format is MAT file or miniSEED, then mass position will also be included.
Oceans 3.0 API filter: dpo_seismometerChannel=All
For Oceans 3.0 API (dataProductDelivery) Users
The Oceans 3.0 API filter parameter values listed above for dpo_seismometerChannel do not correspond to IRIS channel codes, even though some are exactly the same. This may cause confusion for our API users in particular. For instance, IRIS channel codes HHZ and MHZ are also the same text as two of the available values for the dpo_seismometerChannel data product option, a parameter that's supplied in API calls to dataProductDelivery. The dpo_seismometerChannel Oceans 3.0 option/filter values are our shorthand and are not the IRIS channel codes. Only the listed Oceans 3.0 API filter values for dpo_seismometerChannel will work. The Oceans 3.0 option/filters correspond to multiple IRIS channel codes which are returned in the data product request (we overlay multiple channels in plots and bundle them together in file products). For clarity, the data product options listed above are summarized in the table below, showing the IRIS channel codes that will be returned for each Oceans 3.0 API filter value. We've grouped the IRIS channel codes by typical instrument type, and added vertical gaps to group by high/low-rate channels:
| Seismometer Channel Option Description | Oceans 3.0 API Filter Parameter | IRIS Broadband Seismometer Channel Codes | IRIS Short-Period Seismometer Channel Codes | Other IRIS Channel Codes (Accelerometer, Mass Position Seismometer) |
|---|---|---|---|---|
Vertical Velocity (High-Rate/Low-Rate Overlaid in Plots) | *Z |
|
|
|
High-Rate Vertical Velocity | HHZ |
|
|
|
Low-Rate Vertical Velocity | MHZ |
|
|
|
High-Rate Velocity - All Components | HH* |
|
|
|
Low-Rate Velocity - All Components | MH* |
|
|
|
Horizontal Acceleration (High-Rate/Low-Rate Overlaid In Plots) | *N12 | n/a | n/a |
|
High-Rate Horizontal Acceleration | CN12 | n/a | n/a |
|
Low-Rate Horizontal Acceleration | MN12 | n/a | n/a | MN1, MN2, MNN, MNE |
High-Rate Acceleration - All Components | CN* | n/a | n/a |
|
Low-Rate Acceleration - All Components | MN* | n/a | n/a | MN1, MN2, MN3, MNN, MNE, MNZ |
Velocity - All Components (High-Rate/Low-Rate Overlaid in Plots) | *H* |
|
|
|
Acceleration - All Components (High-Rate/Low-Rate Overlaid In Plots) | *N* | n/a | n/a |
|
All Channels (High-Rate/Low-Rate Overlaid In Plots) | All | All channels returned from a location. | ||
Where N/E are the North/East cardinal directions, Z is vertical, and 1/2/3 are non-cardinal orientations. It is possible for the 'All Channels' option (bottom of table) to return channels not included in the other options, such as the low-rate pressure data in the down-hole orientation (MDD,LDD). However, if there is channel data included here that should be part of one or more of the options/filters outlined above or should have a new option/filter, please contact us.
Note: A change in sample rate occurred in 2013 for all seismometers causing the low-rate channels to change from LHZ, LHE, LHN, LNZ, LNE and LNN to MHZ, MHE, MHN, MNZ, MNE and MNN.
File-name mode field
The IRIS channel code is applied in the file mode field at the end of the file name after the date, separated with a '-'. If there is more than one, then they are listed (only occurs for overlaid plots), example: '-EHZ-MHZ'.
Formats
Seismometer data is available as miniSEED binary files, MAT files, and PNG/PDF plots.
miniSEED
Oceans 3.0 API filter: extension=miniseed
These files are produced by IRIS and acquired by IRIS webservice. We use rdmseed.m to convert these files to MAT files.
MAT
The seismometer MAT data files are produced by rdmseed.m and some specialized code to align the miniSEED sections into a single time series per channel. The file also includes a channel metadata struct that is produced by a call to IRIS's metadata service and the generic MAT file Metadata structure - Complex. See the MAT file description for more information on the generic format. Here is a breakdown of all the structures and fields in the MAT file:
Data: a structure array containing the following fields:
- dat: An array of doubles containing seismic scalar data.
- time: An array of doubles containing time stamps for the seismic scalar data.
- Channel: Struct containing seismometer channel information.
- Channel.name: A string containing the channel code of the channel responsible for the seismic scalar data and time stamps.
- Channel.azimuth: A double containing the azimuth of the seismometer.
- Channel.dip: A double containing the dip of the seismometer.
- Channel.sensorDescription: A string containing the make and model of the seismometer.
- Channel.scale: A double containing the scale factor applied to the scalar data.
- Channel.scaleFreq: A double containing the scale frequency in Hz.
- Channel.scaleUnits: Units of the the scalar data before the applied scaling factor.
- Channel.sampleRate: Sample rate of recorded scalar data in samples per second.
Data: here is what the Data structure looks like in MATLAB:


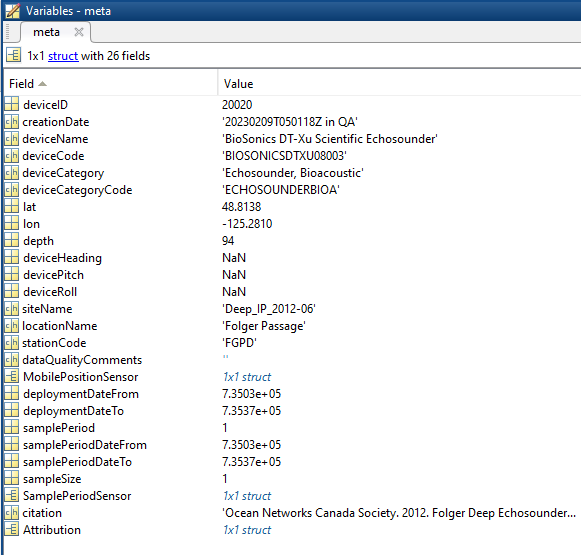
- deviceID: A unique identifier to represent the instrument within the Ocean Networks Canada data management and archiving system.
- creationDate:Date and time (using ISO8601 format) that the data product was produced. This is a valuable indicator for comparing to other revisions of the same data product.
- deviceName: A name given to the instrument.
- deviceCode: A unique string for the instrument which is used to generate data product filenames.
- deviceCategory: Device category to list under data search ('Echosounder').
- deviceCategoryCode: Code representing the device category. Used for accessing webservices, as described here: API / webservice documentation (log in to see this link).
- lat: Fixed value obtained at time of deployment. Will be NaN if mobile or if both site latitude and device offset are null. If mobile, sensor information will be available in mobilePositionSensor structure..
- lon: Fixed value obtained at time of deployment. Will be NaN if mobile or if both site longitude and device offset are null. If mobile, sensor information will be available in mobilePositionSensor structure.
- depth: Fixed value obtained at time of deployment. Will be NaN if mobile or if both site depth and device offset are null. If mobile, sensor information will be available in mobilePositionSensor structure.
- deviceHeading: Fixed value obtained at time of deployment. Will be NaN if mobile or if both site heading and device offset are null. If mobile, sensor information will be available in mobilePositionSensor structure.
- devicePitch: Fixed value obtained at time of deployment. Will be NaN if mobile or if both site pitch and device offset are null. If mobile, sensor information will be available in mobilePositionSensor structure.
- deviceRoll: Fixed value obtained at time of deployment. Will be NaN if mobile or if both site roll and device offset are null. If mobile, sensor information will be available in mobilePositionSensor structure.
- siteName: Name corresponding to its latitude, longitude, depth position.
- locationName: The node of the Ocean Networks Canada observatory. Each location contains many sites.
- stationCode: Code representing the station or site. Used for accessing webservices, as described here: API / webservice documentation (log in to see this link).
- dataQualityComments: In some cases, there are particular quality-related issues that are mentioned here.
- MobilePositionSensor: A structure with information about sensors that provide additional scalar data on positioning and attitude (latitude, longitidue, depth below sea surface, heading, pitch, yaw, etc).
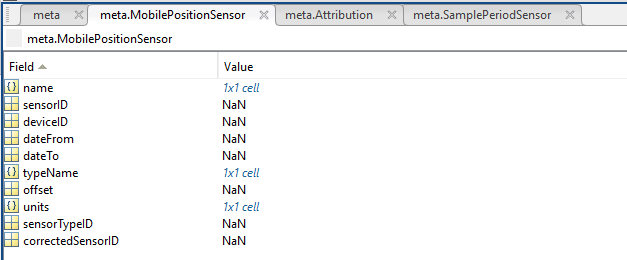
- name: A cell array of sensor names for mobile position sensors. If not a mobile device, this will be an empty cell string.
- sensorID: An array of unique identifiers of sensors that provide position data for mobile devices - this data may be used in this data product.
- deviceID: An array of unique identifiers of devices that provide position data for mobile devices - this data may be used in this data product.
- dateFrom: An array of datenums denoting the range of applicability of each mobile position sensor - this data may be used in this data product.
- dateTo: An array of datenums denoting the range of applicability of each mobile position sensor - this data may be used in this data product.
- typeName: A cell array of sensor names for mobile position sensors. If not a mobile device, this will be an empty cell string. One of: Latitude, Longitude, Depth, COMPASS_SENSOR, Pitch, Roll.
- offset: An array of offsets between the mobile position sensors' values and the position of the device (for instance, if cabled profiler has a depth sensor that is 1.2 m above the device, the offset will be -1.2m).
- sensorTypeID: An array of unique identifiers for the sensor type.
- correctedSensorID: An array of unique identifiers of sensors that provide corrected mobile positioning data. This is generally used for profiling deployments where the latency is corrected for: CTD casts primarily.
- deploymentDateFrom: The date of the deployment on which the data was acquired.
- deploymentDateTo: The date of the end of the deployment on which the data was acquired (will be NaN if still deployed).
- samplingPeriod: Sample period / data rating of the device in seconds, this is the sample period that controls the polling or reporting rate of the device (some parsed scalar sensors may report faster, some devices report in bursts) (may be omitted for some data products).
- samplingPeriodDateFrom: matlab datenum of the start of the corresponding sample period (may be omitted for some data products).
- samplingPeriodDateTo: matlab datenum of the end of the corresponding sample period (may be omitted for some data products).
- sampleSize: the number of readings per sample period, normally 1, except for instruments that report in bursts. Will be zero for intermittent devices (may be omitted for some data products).
- SamplePeriodSensor: A structure array with an entry for each scalar sensor on the device (even though this metadata is for complex data products that don't use scalar sensors).
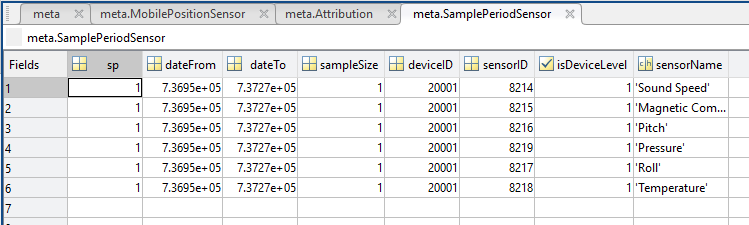
- sp: sample period in seconds (array), unless sensorid is NaN then this is the device sample period
- dateFrom: array of date from / start date (inclusive) for each sample period in MATLAB datenum format.
- dateTo: array of date to / end date (exclusive) for each sample period in MATLAB datenum format.
- sampleSize: the number of readings per sample period (array). Normally 1, except for instruments that report in bursts. Will be zero for intermittent devices.
- deviceID: array of unique identifiers of devices (should all be the same).
- sensorID: array of unique identifiers of sensors on this device.
- isDeviceLevel: flag (logical) that indicates, when true or 1, if the corresponding sample period/size is from the device-level information (i.e. applies to all sensors and the device driver's poll rate).
- sensorName: the name of the sensor for which the sample period/size applies (much more user friendly than a sensorID).
- citation: a char array containing the DOI citation text as it appears on the Dataset Landing Page. The citation text is formatted as follows: <Author(s) in alphabetical order>. <Publication Year>. <Title, consisting of Location Name (from searchTreeNodeName or siteName in ONC database) Deployed <Deployment Date (sitedevicedatefrom in ONC database)>. <Repository>. <Persistent Identifier, which is either a DOI URL or the queryPID (search_dtlid in ONC database)>. Accessed Date <query creation date (search.datecreated in ONC database)>
- Attribution: A structure array with information on any contributors, ordered by importance and date. If an organization has more than one role it will be collated. If there are gaps in the date ranges, they are filled in with the default Ocean Networks Canada citation. If the "Attribution Required?" field is set to "No" on the Network Console then the citation will not appear. Here are the fields:
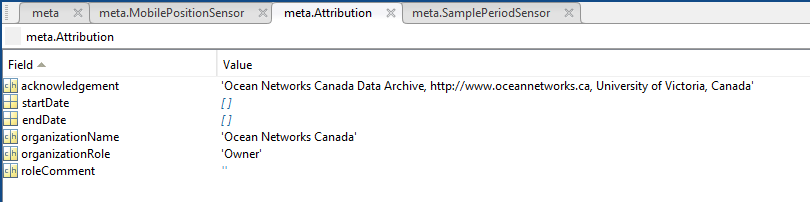
- acknowledgement: the acknowledgement text, usually formatted as "<organizationName> (<organizationRole>)", except for when there are no attributions and the default is used (as shown above).
- startDate: datenum format
- endDate: datenum format
- organizationName
- organizationRole: comma separated list of roles
- roleComment: primarily for internal use, usually used to reference relevant parts of the data agreement (may not appear)
Oceans 3.0 API filter: extension=mat
PNG / PDF: Seismometer Daily Trace Plots
The 24-hour time range is broken down into 48 half-hour line plots. The line colour changes from blue to red every two hours to improve readability, while the small text below the plot indicates the option selected (in some cases they may differ depending on filter and channel availability). If a channel option is selected which states that the channels will be overlaid, the high-rate and low-rate data of the same orientation will be overlaid. This is to fill in the gaps on high-rate data that has been diverted by the military with the low-rate data. When overlaid, the high-rate data is brought to the front and coloured blue and red. The low-rate data is coloured grey. The line spacing is specified below the plot, in a comment footer, to provide users an indication of scale. Also in this text below the plot is a comment stating a change in low-rate filter if one occurred (the title of the plot indicates the channel(s) and filters actually used). The line spacing is dependent on the channels being plotted. If the time range is after March 1st, 2013 for Barkley Canyon, Clayoquot Slope or Main Endeavour Field, or after September 5th 2013 for Cascadia Basin, the sample rates are 200 samples per second (H* channels) or 8 samples per second (M* channels), and the line spacing is 2.9e-06 m/s (vertical velocity), 3.2e-06 m/s (horizontal velocity) and 125 m/s2 (acceleration). If the time-range is before March 1st 2013 for Barkley Canyon, Clayoquot Slope or Main Endeavour Field, or before September 5th 2013 for Cascadia Basin, the sample rates are 100 samples per second (H* channels) and 1 sample per second (L* channels). All velocity line spacing is 5e-05 m/s and all acceleration line spacing is 0.125 m/s2. The difference in line spacing is due to difference in noise on the channel and in an attempt to produce a clear plot with a consistent scaling. Scale factors are accessible in device attributes and are easily modified. Here is an example of a seismometer daily trace plot:

Oceans 3.0 API filter: extension={png,pdf}
Discussion
To comment on this product, log in and click Write a comment... below.